
The migration to GA4 was a significant one - for many reasons. But one of the most disorienting aspects of this transition was coming to terms with a new data model, not just in how it gathers and presents data, but how it reacts to data gathered by Universal Analytics’ data model.
In short, a new data model meant that there was a communication breakdown between Universal Analytics metrics and those used in Google Analytics 4, leading to dissimliarities between reports from one platform to the next.
It can be a real head-scratcher if you’re not aware of how these metrics have evolved under GA4’s new data model, but in today’s article, we’ll be laying it all out in black and white with a Universal Analytics vs. Google Analytics 4 metric comparison.
What are metrics in Google Analytics?
In Google Analytics, metrics are quantitative measurements that provide specific data about user interactions on a website. For example, the Users metric tells you how many people arrived at your website over a given period.
Metrics, alongside their dimensions (non-numerical descriptors), form the backbone of every report you’ll see in Google Analytics. But in order to do so, metrics require definitive rules.
These rules are established by a data model.
What is a data model?
Data models define how data is stored, processed and represented, helping businesses and analysts make sense of the vast amounts of information they collect.
How is the GA4 data model different?
The difference between the retired UA’s data model and the model adopted by GA4 is that the former was based on Sessions and Pageviews, while events and parameters form the foundation of the latter.
This core divergence branched out into several miscommunications between metrics across platforms, even those with the same name, sometimes amounting to missing or skewed data.
Discrepancies between UA & GA4 metrics
From data analysis artificial intelligence to intensified privacy considerations, Google Analytics 4 introduced many new elements, but, in a purely practical sense, the metrics refresh signalled the biggest change for marketers.
Let’s take a look at exactly which metrics are different in Google Analytics 4 — and how!
Users
Total Users and New Users were essential UA macro metrics that provided a general insight into site exposure and performance. They were also very simple metrics, so you’d be forgiven for thinking that they’d look the same in GA4 as they did in UA — an apples-to-apples situation. However, this isn’t the case.
In Universal Analytics, Total Users tallied all site visitors, whether they were a returning user or visiting your website for the first time — New Users counted only the latter.
In GA4, Total Users tallies the overall number of unique users that trigger an event (i.e., users that interacted with a tracked element of your website), and New Users tallies all users who launch your app or trigger an event on your website for the first time.
It’s common for the numbers of both Total Users and New Users to be lower in Google Analytics 4 than they were in Universal Analytics. But this doesn’t necessarily mean GA4 is undercounting. On the contrary, it usually indicates UA was overcounting.
This is because, in GA4, the Users metrics are based on the unique user IDs assigned to individual users, allowing for accurate tracking of user behaviour across browsers and devices.
UA, on the other hand, relied upon cookies and client IDs, meaning it would count users who returned to your site after clearing their cookies, switching browsers or switching devices as additional users.
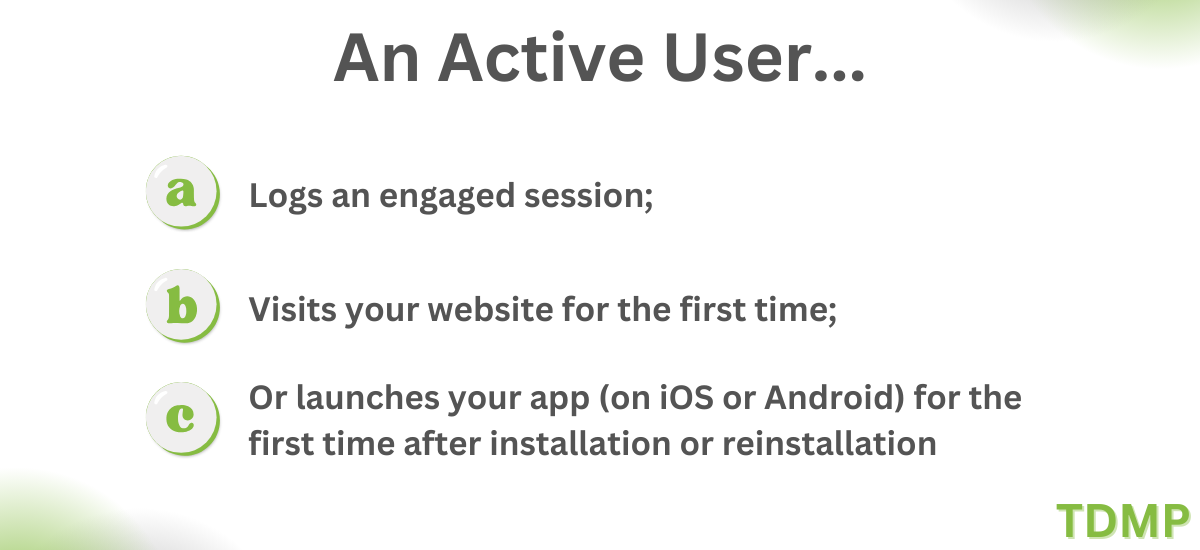
Active Users - the new primary Users metric!
Google Analytics 4 also introduced Active Users. Active Users inherited the role of primary Users metric from UA’s Total Users. This means that, in GA4 reports, 'Users' now represents the new Active Users metric, while in UA, 'Users' referred to the old Total Users metric.
So, despite relying on the same terminology, the numbers in GA4 may differ because the metrics are calculated in distinct ways.
Sessions
Your Sessions figures may appear obscured in GA4 too, reflecting the greater accuracy of GA4’s calculation methods.
The root of the inaccuracy in Universal Analytics was that, despite sharing a 30-minute session timeout default with GA4, it restarted a session at midnight, when the campaign source changed or when a user interacted with a UTM (Urchin Tracking Module) promo code.
In plain English, this means that a single session may have been counted as two. And to make matters worse, in certain circumstances, the new session would override data pertaining to any UTM promo codes engaged with during the initial session — even though they were likely the ones that drove the traffic.
GA4, on the other hand, does not multiply or cut sessions short. Using a flexible, event-based system, it provides a more precise session count with a reduced error rate.
The extent to which your GA4 Sessions data differs to the Sessions data you saw in Universal Analytics is dependent on various factors:
- UTM tagging: As mentioned earlier, UTM tags would trigger a new session in Universal Analytics, so the more there are on your website, the lower your Sessions data will have seemed after migrating to GA4.
- User location: If you have a far-reaching user base, the difference between your timezone and the various timezones of your users means sessions may often run past midnight in your location. In UA, this would lead to additional session counts, but in Google Analytics 4, a session running through midnight will be recorded as single session.
- Filters: In UA, filters were used to exclude data from a report. Google Analytics 4 filters are used to control the passage of data from property to subproperty. This difference in filter functionality causes slight session variations between platforms. The more filters involved – the greater the variation.
Conversions
As long as you set up equivalent conversion events in GA4 for the goals set in UA, you’ll notice your Conversions data from Universal Analytics is largely unchanged, but this isn’t always possible.
Universal Analytics gave you the choice of five goal types to define a conversion (destination, duration, pages/sessions, smart goals and event goals) but Google Analytics 4 supports only one conversion type – conversion events. This means that some of UA’s goals, such as duration and smart goals, cannot be replicated in GA4.
It’s also important to note a difference in how these platforms handle multiple occurrences of the same conversion event within a session. In Universal Analytics, if a user triggered the same conversion goal more than once in a single session, it would only be counted as one conversion.
GA4, by contrast, counts all instances of conversion events in a session, even if they’re duplicate conversions, providing a more detailed and granular view of user interactions.
If preferred, you can change GA4’s conversion counting method to Once per session – which will limit conversion count discrepancies between platforms.
Bounce Rate
You can still add Bounce Rate to custom reports in GA4, but it’s no longer a full-fat metric — and there is a slight difference in how it’s calculated.
In Universal Analytics, if someone left your site after viewing one page without triggering a second request to Analytics’ server, it was considered a bounce. This was a sufficient indication of site performance in the past, but as web development advanced, it began to lose relevance.
After the advent of single-page applications (SPAs), users could interact with content then leave, never having loaded another page. By UA’s definition, this would count as a bounce, suggesting no engagement, which wasn’t actually the case.
By contrast, In GA4, a bounce is simply an unengaged session, which is to say that a user has spent fewer than 10 seconds viewing your webpage and didn’t engage with any interactive elements.
This achieves three things:
- Firstly, GA4’s definition of a bounce provides a much more accurate account of user activity, as it doesn’t lump people interacting with features like SPAs together with those not engaging at all.
- Secondly, it solves the issue of traditional bounce rate being a negative metric but not always equating to negative user engagement. For instance, someone looking for a recipe won’t need load more than one page on a website; they will view the details they need, cook their food, leave the page, and enjoy their meal. The webpage performed its duty perfectly, yet, in UA, it would appear as if it were underperforming.
- Finally, it positions bounce rate as the negative inverse of engagement rate, marrying these new additions in a highly practical manner.
Bounce Rate vs. Engagement Rate
In GA4 Engagement Rate is your Engaged Sessions divided by your overall session count. It is given as a percentage.
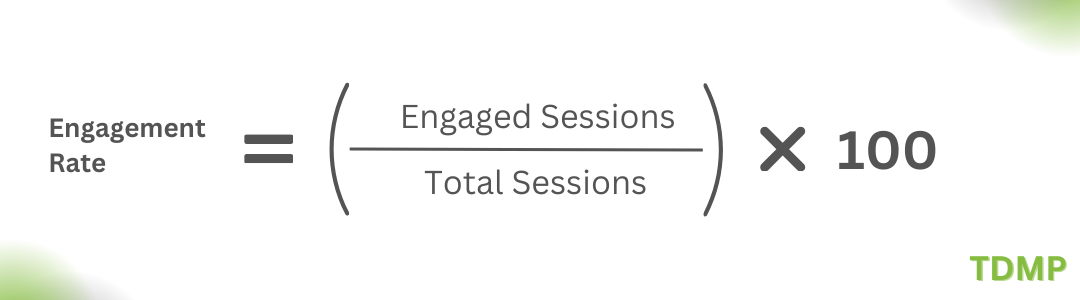
For example, let’s say that of 20,000 total sessions, your web page accrued 8,000 engaged sessions. That would make your engagement rate 40%.
When more people engage with your content, you’ll notice your engagement rates rising, and when people aren’t interacting with your content, you’ll notice them fall. Used in conjunction with page events such as scrolls, video interactions, form submissions or download events, Engagement Rate offers a much truer account of how engaging a webpage is than Bounce Rate.
Side Note: An engaged session is defined as any session that lasts over 10 seconds, results in a conversion or involves multiple screen or page views.
Total Events vs. Event Count
Event Count is the GA4 equivalent of UA’s Total Events metric, but this is more than a mere semantic shift.
With GA4, Google has essentially redefined an event. In UA, you could assign a category, action and a label to an event, meaning it could be applied to any site action that didn’t lead to a subsequent success page, but in GA4, everything is an event… everything!
From page views to video progression to contact submissions — all significant site interactions are classed as events in GA4.
In contrast to Universal Analytics’ unique event system, GA4 works best when the same event names are used multiple times across your site, differentiated by diverse parameter values.
This is why, in most scenarios, GA4 seems to log more events than its predecessor.
Pageviews, Screenviews & Views
The Pageviews metric from Universal Analytics has been renamed Views in Google Analytics 4. Views works slightly differently to Pageviews, but Google’s statement that they generally fall ‘within a few percentage points’ of one another tends to ring true.
In UA, Pageviews tallied the total number of webpages viewed over a given period. It included multiple views of individual pages. To find the total number of pages viewed excluding repeated views of a single page, you’d check the Unique Pageviews metric.
In GA4, Views tallies the total number of both page and app screen views, accounting for the aforementioned minor discrepancy. Like Pageviews, Views includes multiple page or screen views in the count.
If you noticed your Pageview figures were significantly altered under the Views metric, it usually means there were either filters applied only in UA or filters applied only in GA4. For example, if you had set a filter to remove internal traffic from your reports in UA but hadn’t set the same filter in GA4, the difference between reports would have been greater.
It’s also possible that filters set in Universal Analytics were incompatible with GA4’s data model, which, again, would lead to starkly different figures from one platform to the next.
Purchases
Like UA, GA4 uses purchase events to track transactions, but GA4 shifts some of the data-handling responsibility. Google Analytics 4 users are expected to provide the items array directly when collecting a purchase event, rather than relying on pre-provided JavaScript as in UA.
Final thoughts
The transition from Universal Analytics to Google Analytics 4 has introduced significant changes to the way data is tracked and presented, meaning historical data collected in UA often appears altered in the GA4 interface. However, these variances often result in a more precise representation of user interactions, conversions and sessions.
To realise the full potential of GA4 for your business, contact us. Our experienced team can provide expert guidance and assistance in optimising your Analytics setup, PPC approach and SEO strategies.